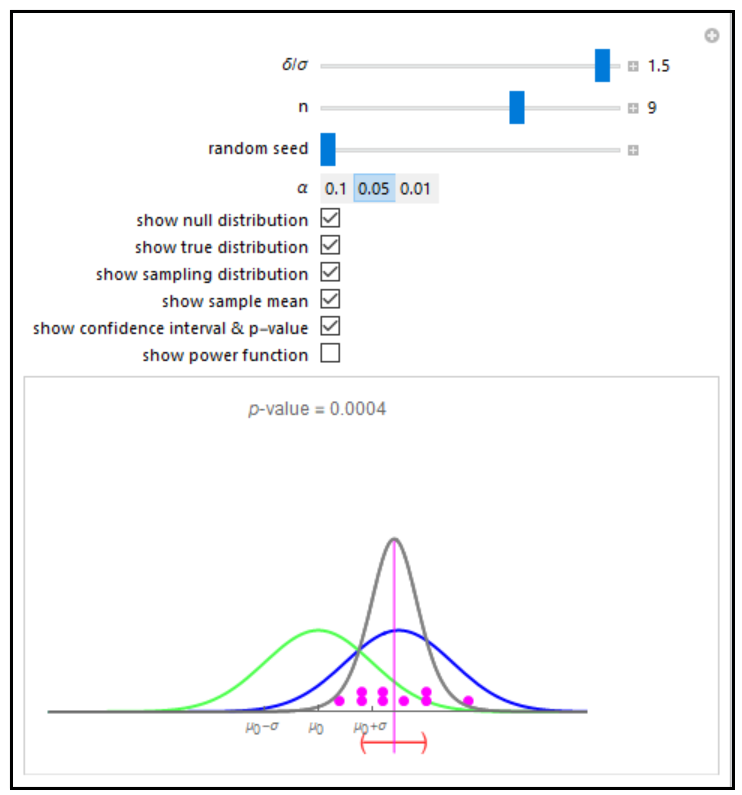
The dot chart represents a random sample of size n = 9 from a normal distribution, shown in blue, with mean μ0 + δ and standard deviation σ. This is the true distribution. This simulation focuses on the null hypothesis, H0: μ = μ0. For hypothesis testing, the sample is assumed to be from a normal population with unknown mean and unknown variance. The hypothetical distribution, N(μ0,σ), is shown in green. When δ = 0, the null distribution and true distribution are the same, but otherwise they are different. The gray curve shows the sampling distribution. The (1 – α)% two-sided confidence interval based on the random sample is shown below with α = 0.05. The confidence interval is colored red, to indicate that the hypothesized mean μ0 is not included in the interval; otherwise the color is blue. So when δ = 0, this confidence interval will be blue about 100(1 – α)% of the time and for larger |δ| this happens less frequently.
The observed two-sided p-value is shown at the top. By using the “random seed” slider, we can see that the p-values are random and depend on the random sample. The sample mean is represented by the thin magenta line extending from the midpoint of the confidence interval to the center value of the sampling density.