Particle in a Box
Description
This simulation illustrates the wavefunctions for the quantum particle in a box, including superposition states.
- The input table (upper left corner) can be edited to change the quantum number \( n \) and expansion coefficient \( C_{n} \)
- Time evolution can be observed with the Start/Stop button, and a probabilistic collapse of the wavefunction can be seen with the Measure button.
- The mass of the particle and box length are adjustable with sliders
- The integrated probability density can be computed over any position range with the lower input table and the Integrate button. The lower limit of integration is designated \( x_{1} \) and the upper limit is \( x_{2} \). The integrated probability appears under the box labeled, “integral”.
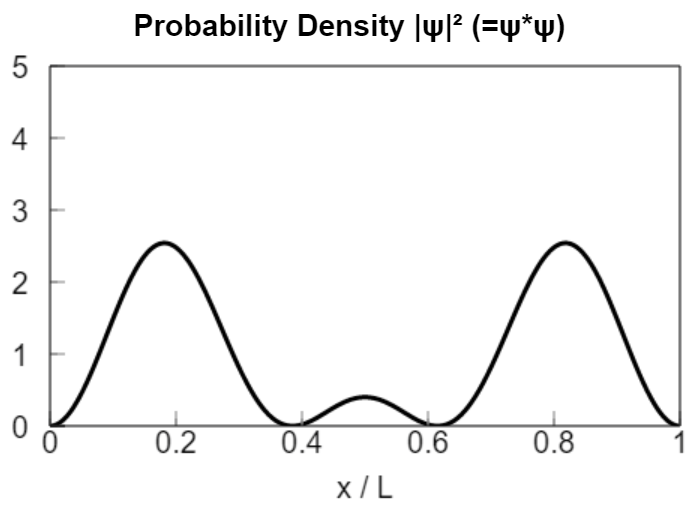
- Probability density is plotted in the upper right, while real and imaginary components of the wave, as well as total system energy, are additionally shown in the two bottom plots.
- The probability density plot has a fixed scale so that relative comparisons can be made, and coefficients \( C_{n} \) are normalized.
- The energy plot and probability density plot can be combined by pressing “show as single plot”. Note that the height of the probability density function will no longer scale vertically (i.e. compress or expand) in this mode. It is normalized to a height of 50 pixels and remains on top of the red ‘energy line’.
view simulation
About
This simulation was made at the University of Colorado Boulder, Department of Chemical and Biological Engineering. Author(s): Sky Christana, Neil Hendren
Embed code: